4. Area and Average Value
Exercises
-
\(f(x)=-x^2+4x-2\), \(a=1\) and \(b=3\).
Remember the area under a function is the integral of the function: \[ A=\int_a^b f(x)\,dx \]
\(A=\dfrac{10}{3}\)
The area is \[\begin{aligned} A&=\int_1^3 (-x^2+4x-2)\,dx \\ &=\left[-\dfrac{x^3}{3}+2x^2-2x\right]_1^3 \\ &=(-9+18-6)-\left(-\dfrac{1}{3}+2-2\right) =\dfrac{10}{3} \end{aligned}\]
jm,db
-
\(f(x)=x^3+2x\), \(a=0\) and \(b=4\).
\(\displaystyle A=48\)
The area is \[\begin{aligned} A&=\int_0^4 (x^3+2x)\,dx =\left[\dfrac{x^4}{4}+x^2\right]_0^4 \\ &=\left[\dfrac{4^4}{4}+4^2\right]-0 =64+16=80 \end{aligned}\]
-
\(f(x)=e^x+1\), \(a=-1\) and \(b=2\).
\(A=e^2-\dfrac{1}{e}+3\)
The area is \[\begin{aligned} A&=\int_{-1}^{2} (e^x + 1)\,dx =\left[\rule{0pt}{10pt}e^x + x\right]_{-1}^{2} \\ &=\left[(e^2 + 2)-\left(\dfrac{1}{e}-1\right)\right] \\ &=e^2 -\dfrac{1}{e} + 3 \end{aligned}\]
db
-
\(f(x)=x(x^2+1)^{5}\), \(a=0\) and \(b=1\).
You'll need to use a substitution to do the integral.
\(\displaystyle A=\dfrac{21}{4}\)
The area is the integral: \[ A=\int_0^1 x(x^2+1)^{5}\,dx \] To do the integral, we make the substitution \(u=x^2+1\). Then \(du=2x\,dx\) and \(x\,dx=\dfrac{1}{2}\,du\). So the area is: \[ A=\dfrac{1}{2}\int_1^2 u^{5}\,du =\dfrac{1}{2}\left[\dfrac{u^{6}}{6}\right]_1^2 =\dfrac{2^6-1}{12} =\dfrac{21}{4} \]
_rect_anim.gif)
jm,db
-
Challenge: The total sales of widgets sold since they went on the market is given by the function \(G(t)\) where \(t\) is time in days. So the rate they are being sold is \(G'(t)\). Explain in practical terms what the area of the region \(R\) represents where \(R\) is the region below the graph of \(G'(t)\), above the horizontal axis and between times \(t_1\)and \(t_2\).
Recall the Fundamental Theorem of the Calculus.
By the Fundamental Theorem: \[ \int_{t_1}^{t_2} G'(t)dt=G(t_2)-G(t_1) \] The left side of this equation is the area of \(R\). The right side is the difference between total sales by day \(t_2\) and by day \(t_1\). So the area represents the sales between day \(t_1\) and day \(t_2\).
jm
-
\(f(x)=x^3\) and \(g(x)=x^2\)
To find where they intersect, we equate them.
To see which is on top, evaluate each function at \(x=\dfrac{1}{2}\).\(A=\dfrac{1}{12}\)
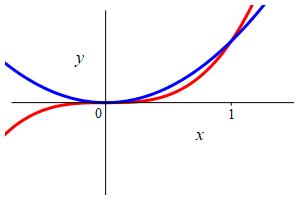
To find where they intersect, we equate them: \[\begin{aligned} x^3=x^2 \quad &\Rightarrow \quad x^3-x^2=0 \\ &\Rightarrow \quad x^2(x-1)=0 \end{aligned}\] They intersect at \(x=0\) and \(x=1\).
To see which is on top, we evaluate at \(x=\dfrac{1}{2}\): \[\begin{aligned} f\left(\dfrac{1}{2}\right)&=\left(\dfrac{1}{2}\right)^3=\dfrac{1}{8} \\ g\left(\dfrac{1}{2}\right)&=\left(\dfrac{1}{2}\right)^2=\dfrac{1}{4} \end{aligned}\]
So \(g(x)=x^2\) is bigger and on top. So the area is: \[ A=\int_0^1 (x^2-x^3)\,dx =\left[\dfrac{x^3}{3}-\dfrac{x^4}{4}\right]_0^1 =\dfrac{1}{3}-\dfrac{1}{4} =\dfrac{1}{12} \]
jm,db
-
\(f(x)=x-1\) and \(g(x)=x^2-4x+3\)
\(A=\dfrac{9}{2}\)
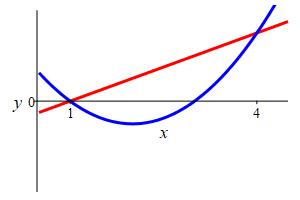
We first find the points of intersection: \[\begin{aligned} x-1&=x^2-4x+3 \\ 0&=x^2-5x+4=(x-4)(x-1) \\ &\Rightarrow x=1,4 \end{aligned}\] Since \(f\) is the upper function, we evaluate: \[\begin{aligned} \int_1^4 &[(x-1)-(x^2-4x+3)]\,dx \\ &=\int_1^4 (-x^2+5x-4)\,dx \\ &=\left[-\dfrac{x^3}{3}+\dfrac{5x^2}{2}-4x\right]_1^4 \\ &=-\dfrac{64}{3}+40-16+\dfrac{1}{3}-\dfrac{5}{2}+4 =\dfrac{9}{2} \end{aligned}\]
jm,db
-
\(f(x)=x^3-4x\) and \(g(x)=5x\)
\(A=\dfrac{81}{2}\)
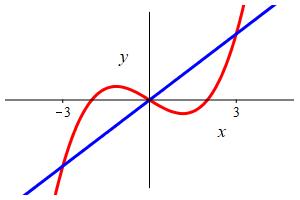
We first solve for the intersection points: \[\begin{aligned} &x^3-4x=5x \quad \Rightarrow \quad x^3-9x=0 \\ &\Rightarrow \quad x(x-3)(x+3)=0 \quad \Rightarrow \quad x=-3,0,3 \end{aligned}\] So we need to break the integral into two pieces. From the graph we see that the cubic is on top for the first integral while the line is on top for the second integral. We can check this by plugging in \(x=1\): \[ f(1)=-3 \qquad g(1)=5 \] So \(g(x)\) is bigger on the right. The area is:
\[\begin{aligned} A&=\int_{-3}^0 \text{upper}-\text{lower}\,dx +\int_0^3 \text{upper}-\text{lower}\,dx \\ &=\int_{-3}^0 [(x^3-4x)-5x]\,dx+\int_0^3 [5x-(x^3-4x)]\,dx \\ &=\int_{-3}^0 [x^3-9x]\,dx+\int_0^3 [9x-x^3]\,dx \\ &=\left[\dfrac{x^4}{4}-9\dfrac{x^2}{2}\right]_{-3}^0 +\left[ 9\dfrac{x^2}{2}-\dfrac{x^4}{4}\right]_0^3 \\ &=[ 0]-\left[\dfrac{81}{4}-9\dfrac{9}{2}\right] +\left[ 9\dfrac{9}{2}-\dfrac{81}{4}\right]-[ 0] =\dfrac{81}{2} \end{aligned}\]
jm
Since the region is symmetric, we could have doubled the area of one piece: \[ A=2\int_0^3 [ 5x-(x^3-4x)]\,dx \]
-
\(y=e^x\), \(y=e^{-x}\) and \(x=2\)
Notice this region is to the right of both exponentials.
\(A=e^2+e^{-2}-2\)
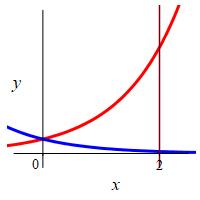
The exponentials intersect when \(e^x=e^{-x}\) or \(e^{2x}=1\) or \(x=0\). So the area is: \[\begin{aligned} A&=\int_0^2 (e^x-e^{-x})\,dx =[e^x+e^{-x}]_0^2 \\ &=[e^2+e^{-2}]-[e^0+e^0] =e^2+e^{-2}-2 \end{aligned}\]
jm,db
-
\(y=e^x\), \(y=e^{-x}\) and \(y=2\)
Notice this region is above both exponentials and is symmetric about the \(y\)-axis.
\(A=4\ln 2-2\)
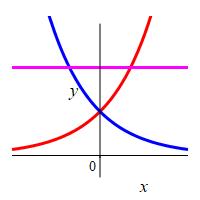
By symmetry, we will double the area to the right of \(x=0\). The line \(y=2\) intersects the exponential \(y=e^x\) at \(x=\ln2\). So: \[\begin{aligned} A&=2\int_0^{\ln 2} (2-e^x)dx =2\left[\rule{0pt}{10pt}2x-e^x\right]_0^{\ln 2} \\ &=2[ 2\ln 2-e^{\ln 2}-(0-1)] \\ &=2[ 2\ln 2-2+1] =4\ln 2-2 \end{aligned}\]
jm,db
-
\(f(x)=x^3+x^2-6x\)
This is the area between 2 curves, one the graph of \(f\) and the other the \(x\)-axis.
\(A=\dfrac{253}{12}\)
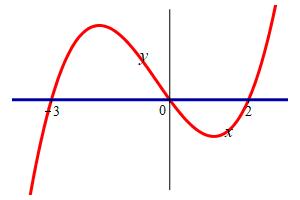
We first find x-intercepts: \[ x^3+x^2-6x=x(x-2)(x+3)=0 \] \[ x=-3,0,2 \] From the factored formula, we see that the cubic is positive for \(-3 \lt x \lt 0\) and negative for \(0 \lt x \lt 2\). So the cubic is on top in the first integral and on bottom in the second integral:
\[\begin{aligned} A&=\int_{-3}^0 \text{upper}-\text{lower}\,dx +\int_0^2 \text{upper}-\text{lower}\,dx \\ &=\int_{-3}^0 [(x^3+x^2-6x)-0]\,dx+\int_0^2 [0-(x^3+x^2-6x)]\,dx \\ &=\dfrac{63}{4}+\dfrac{16}{3}=\dfrac{253}{12} \end{aligned}\]
jm,db
-
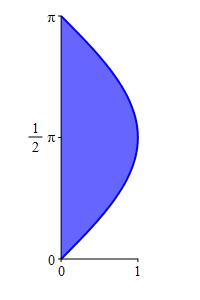
\(x=\sin y\) for \(0 \le y \le \pi\)
\(A=2\)
The area is: \[\begin{aligned} A&=\int_0^\pi\sin y\,dy =\left[-\cos y\rule{0pt}{12pt}\right]_0^\pi \\ &=-(-1)-(-1)=2 \end{aligned}\]
jm,db
-
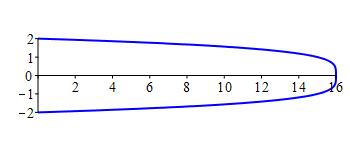
\(x=16-y^4\)
\(A=\dfrac{256}{5}\)
We find the endpoints: \[ 16-y^4=0 \quad \Rightarrow \quad y=\pm2 \] \[\begin{aligned} A&=\int_{-2}^2 (16-y^4)\,dy =\left[16y-\dfrac{y^5}{5}\right]_{-2}^2 \\ &=2\left(32-\dfrac{32}{5}\right) =\dfrac{256}{5} \end{aligned}\]
jm,db
-
\(y^2=1+x\) and the line joining \((-1,0)\) and \((0,1)\)
Write the edges with \(x\) as a function of \(y\). What are the endpoints? Which curve is on the right (larger \(x\))?
\(A=\dfrac{1}{6}\)
As functions of \(y\) the edges are the parabola \(x=y^2-1\) and the line \(x=y-1\). From the plot we see they intersect at \(y=0\) and \(y=1\). However, if we do not have a plot, we can find where they intersect by equating them: \[ y^2-1=y-1 \quad \text{or} \quad y=0,1 \] From the plot we see that the line is on the right and the parabola is on the left. However, if we do not have a plot, we can plug in \(y=\dfrac{1}{2}\) into the parabola to get \(x=-\dfrac{3}{4}\) and into the line to get \(x=-\dfrac{1}{2}\). So the line is on the right.
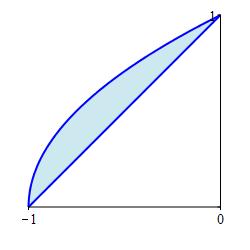
Then the area is: \[\begin{aligned} A&=\int_0^1 (y-1)-(y^2-1)\,dy =\int_0^1 (y-y^2)\,dy \\ &=\left[\dfrac{y^2}{2}-\dfrac{y^3}{3}\right]_0^1 =\dfrac{1}{2}-\dfrac{1}{3}=\dfrac{1}{6} \end{aligned}\]
jm,db
-
\(x=y^3-9y\) and the \(y\)-axis.
What are the intersection points? When is \(x \gt 0\)? When \(x \lt 0\)?
\(A=\dfrac{81}{2}\).
The function intersect the \(y\)-axis when \(0=y^3-9y=y(y^2-9)\) or \(y=-3,0,3\).
When we plug in \(y=1\), we get \(x=-8\).
When we plug in \(y=-1\), we get \(x=8\).
So the curve is to the left of the \(y\)-axis for \(y \ge 0\) and to the right of the \(y\)-axis for \(y \le 0\).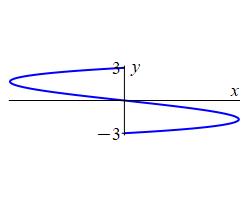
So the area is: \[\begin{aligned} A&=\int_{-3}^0 (y^3-9y)-(0)\,dy+\int_0^3 (0)-(y^3-9y)\,dy \\ &=\left[\dfrac{y^4}{4}-\dfrac{9y^2}{2}\right]_{-3}^0 +\left[-\dfrac{y^4}{4}+\dfrac{9y^2}{2}\right]_0^3 \\ &=2\left(-\dfrac{81}{4}+\dfrac{81}{2}\right) =\dfrac{81}{2} \end{aligned}\]
jm
-
\(f(x)=x^3\) on \([-1,2]\)
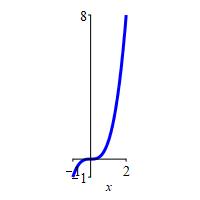
\(f_\text{ave}=\dfrac{5}{4}\)
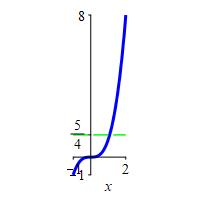
\[\begin{aligned} f_\text{ave} &=\dfrac{1}{2-(-1)}\int_{-1}^2 x^3\,dx =\dfrac{1}{3}\left[ \dfrac{x^4}{4}\right]_{-1}^2 \\ &=\dfrac{1}{12}(16-1) =\dfrac{5}{4} \end{aligned}\]
jm,py
-
\(f(x)=x^4-x^2\) on \([ 0,2]\)
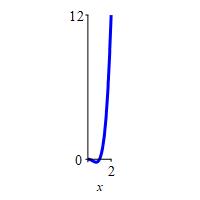
\(f_\text{ave}=\dfrac{28}{15}\)
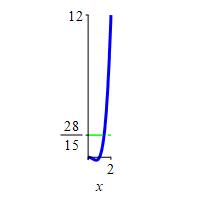
\[\begin{aligned} f_\text{ave} &=\dfrac{1}{2}\int_0^2 (x^4-x^2)\,dx =\dfrac{1}{2}\left[\dfrac{x^5}{5}-\dfrac{x^3}{3}\right]_0^2 \\ &=\dfrac{1}{2}\left(\dfrac{32}{5}-\dfrac{8}{3}\right)=\dfrac{28}{15} \end{aligned}\]
jm,py
-
The identity \(\sin^2 x=\dfrac{1-\cos(2x)}{2}\) allows us to do the
following integrals. See the chapter on
Trig Integrals.
-
Compute \(\displaystyle \int \sin^2 x\,dx\).
\(\displaystyle \int \sin^2 x\,dx =\dfrac{1}{2}\left(x-\dfrac{\sin(2x)}{2}\right)+C \)
\[\begin{aligned} \int \sin^2 x\,dx &=\dfrac{1}{2}\int [1-\cos(2x)]\,dx \\ &=\dfrac{1}{2}\left(x-\dfrac{\sin(2x)}{2}\right)+C \end{aligned}\]
jm
If \(f(x)=\dfrac{1}{2}\left(x-\dfrac{\sin(2x)}{2}\right)\) then: \[ \dfrac{df}{dx} =\dfrac{1}{2}\left(1-\cos(2x)\right) =\sin^2 x \]
-
Find the average value of \(\sin^2 x\) on \(\left[0,\dfrac{\pi}{4}\right]\).
The average value of \(f\) on \(\left[0,\dfrac{\pi}{4}\right]\) is \(\displaystyle f_\text{ave}=\dfrac{4}{\pi}\int_0^{\pi/4} f(x)\,dx\).
The average value of \(\sin^2 x\) on \(\left[0,\dfrac{\pi}{4}\right]\) is \(\dfrac{1}{2}-\dfrac{1}{\pi}\).
If \(f=\sin^2 x\), then \[\begin{aligned} f_\text{ave} &=\dfrac{4}{\pi}\int_0^{\pi/4} \sin^2 x\,dx \\ &=\dfrac{4}{\pi}\dfrac{1}{2}\left[x-\dfrac{\sin(2x)}{2}\right]_0^{\pi/4} \\ &=\dfrac{2}{\pi}\left(\dfrac{\pi}{4}-\dfrac{\sin\dfrac{\pi}{2}}{2}\right) =\dfrac{1}{2}-\dfrac{1}{\pi} \end{aligned}\]
jm
-
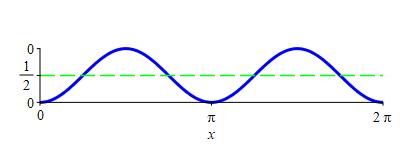
Find the average value of \(\sin^2 x\) on \([0,2\pi]\).
The average value of \(f\) on \([0,2\pi]\) is \(\displaystyle f_\text{ave}=\dfrac{1}{2\pi}\int_0^{2\pi} f(x)\,dx\).
The average value of \(\sin^2 x\) on \([0,2\pi]\) is \(\dfrac{1}{2}\).
If \(f=\sin^2 x\), then \[\begin{aligned} f_\text{ave} &=\dfrac{1}{2\pi}\int_0^{2\pi} \sin^2 x\,dx \\ &=\dfrac{1}{2\pi}\dfrac{1}{2}\left[x-\dfrac{\sin(2x)}{2}\right]_0^{2\pi} \\ &=\dfrac{1}{4\pi}\left(2\pi-\dfrac{\sin4\pi}{2}\right) =\dfrac{1}{2} \end{aligned}\]
jm
This should not be surprising. If we look at the graph of \[ y=\sin^2 x=\dfrac{1-\cos(2x)}{2} \] the center line is \(y=\dfrac{1}{2}\).
py
-
-
\(y=e^x\) on \([0,2]\)
The height is the average value of the function.
\(y_\text{ave}=\dfrac{e^2-1}{2} \approx3.2\)
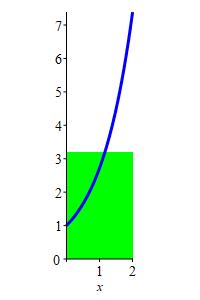
\[\begin{aligned} y_\text{ave} &=\dfrac{1}{2}\int_0^2 e^x\,dx =\dfrac{1}{2}\left[e^x\rule{0pt}{12pt}\right]_0^2 \\ &=\dfrac{e^2-1}{2} \approx3.2 \end{aligned}\] Notice the area of the rectangle is the same as the area below the curve.
jm,py
-
\(f(x)=x^4-4x^2+4\) on \([-2,2]\)
The height is the average value of the function.
\(f_\text{ave}=\dfrac{28}{15}\)
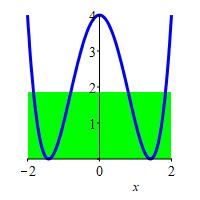
\[\begin{aligned} f_\text{ave} &=\dfrac{1}{2-(-2)}\int_{-2}^2 (x^4-4x^2+4)\,dx \\ &=\dfrac{1}{4}\left[\dfrac{x^5}{5}-\dfrac{4x^3}{3}+4x\right]_{-2}^2 \\ &=2\cdot\dfrac{1}{4}\left(\dfrac{2^5}{5}-\dfrac{4\cdot2^3}{3}+4\cdot2\right) \\ &=\dfrac{2^4}{5}-\dfrac{4\cdot2^2}{3}+4 \\ &=\dfrac{48-80+60}{15}=\dfrac{28}{15} \end{aligned}\]
jm,py
-
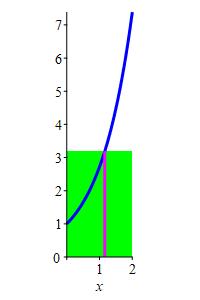
\(f(x)=e^x\) on \([ 0,2]\)
Solve \(f(c)=f_\text{ave}\).
\(c=\ln\dfrac{e^2-1}{2}\approx1.16\)
Since \(f_\text{ave}=\dfrac{e^2-1}{2}\), (See a previous exercise.) we solve \[ f(c)=e^c=f_\text{ave}=\dfrac{e^2-1}{2} \] to get: \[ c=\ln\dfrac{e^2-1}{2}\approx1.16 \]
jm,py
-
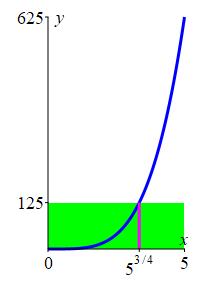
\(f(x)=x^4\) on \([ 0,5]\)
Solve \(f(c)=f_\text{ave}\).
\(c=5^{3/4}\approx3.34\)
We first find the average: \[ f_\text{ave} =\dfrac{1}{5}\int_0^5 x^4\,dx =\left[\dfrac{1}{25}x^5\right]_0^5 =125 \] Then we solve \(f(c)=f_\text{ave}\): \[ c^4=125 \quad \Rightarrow \quad c=5^{3/4}\approx3.34 \]
jm
-
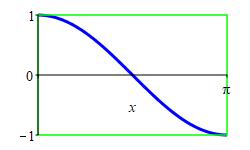
Find the area of the region between \(y=\cos x\) and \(y=1\), for \(0 \le x \le \pi\).
\(A=\pi\)
\[ A=\int_0^\pi 1-\cos x\,dx =\left[x-\sin x\right]_0^\pi =\pi-\sin\pi =\pi \]
jm
This should not be surprising. If we look at the graph of \(\cos x\), we see the required area is half of the area of the rectangle, \(0 \le x \le \pi\) and \(-1 \le y \le 1\), whose area is \(2\pi\).
py
-
\(x=1-y^{2}\), \(y\)-axis
Is this an \(x\)-integral or a \(y\)-integral?
\(A = \dfrac{4}{3}\)
The curve \(x=1-y^{2}\) intersects the \(y\)-axis at \(y=\pm1\). So the area is: \[\begin{aligned} A&=\int_{-1}^1 (1-y^2) \,dy =\left[y-\dfrac{y^{3}}{3}\right]_{-1}^1 \\ &=1-\dfrac{1^3}{3}-\left(-1-\dfrac{(-1)^3}{3}\right) =2(1-\dfrac{1}{3}) =\dfrac{4}{3} \end{aligned}\]
jr
-
\(y=x^{3}-3x^{2}\), \(x\)-axis
Where do the function intersect? Which function is bigger in each piece?
\(A = \dfrac{27}{4}\)
Let \(f(x)=x^{3}-3x^{2}\) and \(g(x)=0\). We first find where the curves intersect: \[ x^{3}-3x^{2}=0 \implies x=0,3 \] To see which is bigger, we try a point in between, \(x=1\): \[ f(1)=1^{3}-3\cdot1^{2}=-2 \quad\text{and}\quad g(1)=0 \] So \(g(x)=0\) is on top. This is confirmed in a plot.
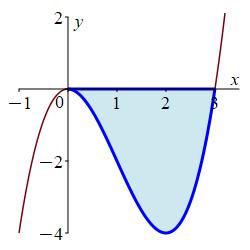
So the area is: \[\begin{aligned} A&=\int_0^3 g(x)-f(x)\,dx =\int_0^3 -x^3+3x^2 \,dx \\ &=\left[-\,\dfrac{x^4}{4}+x^3\right]_0^3 =-\,\dfrac{81}{4}+27 =-\,\dfrac{81}{4}+\dfrac{108}{4} =\dfrac{27}{4} \end{aligned}\]
jr
-
\(y=x^{3}-3x\), \(x\)-axis
Where do the function intersect? Which function is bigger in each piece?
\(A = \dfrac{9}{2}\)
Let \(f(x)=x^{3}-3x\) and \(g(x)=0\). We first find where the curves intersect: \[ x^{3}-3x=0 \implies x=0,\pm\sqrt 3 \] We find which is on top or bottom by evaluating \(f\) at a number in each interval: \[\begin{aligned} f(-1)&=-1+3=2 \gt 0 \\ f(1)&=1-3=-2 \lt 0 \end{aligned}\] So the \(f\) is on the top from \(-\sqrt3\) to \(0\) and on the bottom from \(0\) to \(\sqrt3\). This is confirmed in a plot.
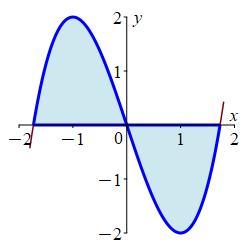
So the area is: \[\begin{aligned} A&=\int_{-\sqrt 3}^0 (f(x)-g(x))\,dx+\int_0^{\sqrt 3} (g(x)-f(x))\,dx \\ &=\int_{-\sqrt 3}^0 (x^3-3x)\,dx+\int_0^{\sqrt 3} (-x^3+3x)\,dx \\ &=\left[\dfrac{x^4}{4}-\dfrac{3x^2}{2}\right]_{-\sqrt 3}^0 +\left[-\,\dfrac{x^4}{4}+\dfrac{3x^2}{2}\right]_0^{\sqrt 3} \\ &=-\left(\dfrac{9}{4}-\dfrac{9}{2}\right)+\left(-\dfrac{9}{4}+\dfrac{9}{2}\right) =2\left(\dfrac{9}{4}\right) = \dfrac{9}{2} \end{aligned}\] Note: We could have doubled either one of these integrals since the region is symmetric.
jr
In each of the following problems, find the area under the graph of \(f\), above the \(x\)-axis, between \(x=a\) and \(x=b\).
In each of the following problems, sketch the region between the graphs of \(f\) and \(g\) and find its area.
In each of the following problems, sketch the region bounded by the given curves and find its area.
In each problem, sketch the region(s) bounded by the graph of \(f\) and the \(x\)-axis. Then compute its area.
In each problem, sketch the region(s) bounded by the graph of \(f\) and the \(y\)-axis. Then compute its area.
In each of the following problems, sketch the region bounded by the graphs of the given functions and find its area.
In each of the following problems, find the average value of the given function on the given interval. Plot the function and its average.
In each of the following problems, find the height of a rectangle whose base is the given interval on the \(x\)-axis and whose area matches that of the region below the given function on the given interval. Plot the function and the rectangle.
In each of the following problems, find the value(s) of \(c\) guaranteed by the Mean Value Theorem for Integrals for the given function on the given interval.
Do the tutorial repeatedly until you feel confident in estimating and finding averages.
Review Exercises
Find the area of the region bounded by the given curves and lines.
Heading
Placeholder text: Lorem ipsum Lorem ipsum Lorem ipsum Lorem ipsum Lorem ipsum Lorem ipsum Lorem ipsum Lorem ipsum Lorem ipsum Lorem ipsum Lorem ipsum Lorem ipsum Lorem ipsum Lorem ipsum Lorem ipsum Lorem ipsum Lorem ipsum Lorem ipsum Lorem ipsum Lorem ipsum Lorem ipsum Lorem ipsum Lorem ipsum Lorem ipsum Lorem ipsum