10. Area and Average Value
c. Area as a \(y\)-Integral
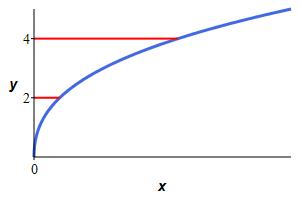
On the previous pages, we computed the area of a region whose edges were
specified by giving \(y\) as a function of \(x\). We now look at regions
whose edges are specified by giving \(x\) as a function of \(y\).
Everything is the same as previously, except we need to turn our heads
sidewise.
![]()
Find the area to the left of a function \(x=f(y)\) and to the right of a function \(x=g(y)\) between \(y=c\) and \(y=d\).
This time divide the region into \(n\) horizontal rectangles each of height \(\Delta y=\dfrac{d-c}{n}\) and width \(f(y_i^*)-g(y_i^*)\) where \(y_i^*\) is a point in the \(i^\text{th}\) interval.
The area is then obtained by adding up the areas of the rectangles and taking the limit as the number of rectangles becomes large, (\(n\rightarrow\infty\)): \[ A=\lim_{n\rightarrow\infty}\sum_{i=1}^n [f(y_i^*)-g(y_i^*)]\Delta y \] This limit of the sum is recognized as the integral \[ A=\int_c^d [f(y)-g(y)]\,dy \]
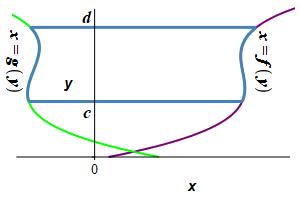
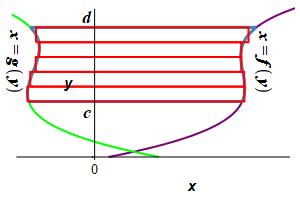
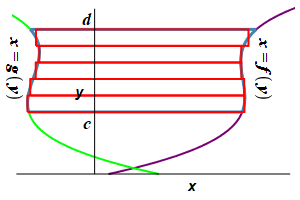
The area to the left of a function \(x=f(y)\) and to the right of a function \(x=g(y)\) between \(y=c\) and \(y=d\) is: \[ A=\int_c^d [f(y)-g(y)]\,dy \]
Find the area between the parabolas \(x=2y^2\) and \(x=3+y^2\).
We plot the curves to get an idea of the shape. The curves are both parabolas opening to the right. To find the intersection points, we equate the functions and solve for \(y\): \[\begin{aligned} 2y^2&=3+y^2 \\ y^2&=3 \\ y&=\pm\sqrt{3} \end{aligned}\] Then the area is
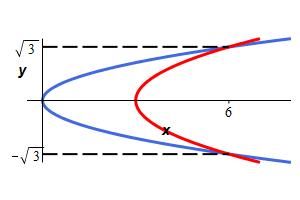
\[\begin{aligned} A&=\int_{-\sqrt{3}}^{\sqrt{3}} [\text{right}-\text{left}]\,dy =\int_{-\sqrt{3}}^{\sqrt{3}} [(3+y^2)-(2y^2)]\,dy \\ &=\int_{-\sqrt{3}}^{\sqrt{3}} (3-y^2)\,dy =\left[ 3y-\dfrac{y^3}{3}\right]_{y=-\sqrt{3}}^{\sqrt{3}} \\ &=2\left[ 3\sqrt{3}-\dfrac{\sqrt{3}^3}{3}\right] =4\sqrt{3} \end{aligned}\]
Find the area between \(x=y^3+3y^2\) and the \(y\)-axis for \(2 \le y \le 4\).
You don't really need a graph, but here it is:
\(\displaystyle A=\int_2^4 (y^3+3y^2)\,dy=116\)
This is a simple area under a curve but in the \(y\) direction. \[\begin{aligned} A&=\int_2^4 (y^3+3y^2)\,dy =\left[\dfrac{y^4}{4}+y^3\right]_2^4 \\ &=[64+64]-[4+8]=116 \end{aligned}\]
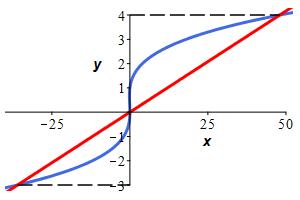
Find the area between \(x=y^3-y^2\) and \(x=12y\).
Here is the graph of the two curves:
\(\displaystyle A=\int_{-3}^0 (y^3-y^2-12y)\,dy +\int_0^4 (12y-y^3+y^2)\,dy =\dfrac{937}{12}\)
The cubic is \(0\) at \(y=0\) and \(y=1\) and is positive for \(y \gt 1\). It's graph and the graph of the line are shown. We find the points of intersection by setting the curves equal: \[\begin{aligned} y^3-y^2&=12y \\ y^3-y^2-12y&=0 \\ y(y-4)(y+3)&=0 \end{aligned}\] So, the curves intersect at \(y=-3,0,4\).
For \(-3 \lt y \lt 0\), the cubic is to the right of the line. (Check \(y=-1\).) For \(0 \lt y \lt 4\), the line is to the right of the cubic. (Check \(y=1\).) So the area is \[\begin{aligned} A&=\int_{-3}^0 (y^3-y^2-12y)\,dy +\int_0^4 (12y-y^3+y^2)\,dy \\ &=\left[\dfrac{y^4}{4}-\dfrac{y^3}{3}-6y^2\right]_{-3}^0 +\left[6y^2-\dfrac{y^4}{4}+\dfrac{y^3}{3}\right]_0^4 \\ &=(0)-\left(\dfrac{81}{4}+9-54\right) +\left(96-64+\dfrac{64}{3}\right)-(0) \\ &=77+\dfrac{-243+256}{12} =\dfrac{937}{12} \end{aligned}\]
You can also practice computing Areas as \(y\)-Integrals by using the following Maplet (requires Maple on the computer where this is executed):
Now look at the problems where \(x\) is a function of \(y\).
Heading
Placeholder text: Lorem ipsum Lorem ipsum Lorem ipsum Lorem ipsum Lorem ipsum Lorem ipsum Lorem ipsum Lorem ipsum Lorem ipsum Lorem ipsum Lorem ipsum Lorem ipsum Lorem ipsum Lorem ipsum Lorem ipsum Lorem ipsum Lorem ipsum Lorem ipsum Lorem ipsum Lorem ipsum Lorem ipsum Lorem ipsum Lorem ipsum Lorem ipsum Lorem ipsum