19. Properties of Graphs
f. Interpreting Graphs
1. Of the First Derivative
Given a function \(f(x)\), we can graph \(f(x)\), \(f'(x)\) and \(f''(x)\). We here look at what each graph says about the other two. For example:
- The intervals on which \(f'(x)\) is positive, are the intervals on which \(f(x)\) is increasing.
- The intervals on which \(f''(x)\) is negative, are the intervals on which \(f'(x)\) is decreasing and on which \(f(x)\) is concave down.
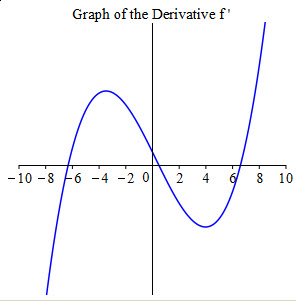
The figure at the right shows the graph of \(f'(x)\). Answer each question using only the numbers: \[\begin{aligned} &-10.00, \quad -9.00, \quad -6.32, \quad -3.48,\quad -1.00, \\ &.49,\quad 2.00, \quad 3.98, \quad 6.59, \quad 9.00, \quad 10.00 \end{aligned}\] Assume the behavior of the graph at the left and right continues out to \(-10\) and \(10\).
-
On what interval(s) is \(f(x)\) decreasing?
\(f(x)\) is decreasing when \(f'(x) \lt 0\).
\([-10.00, -6.32], [.49, 6.59]\)
\(f(x)\) is decreasing when \(f'(x) \lt 0\). Looking at the graph, \(f'(x) \lt 0\) on the intervals \([-10.00, -6.32]\) and \([.49, 6.59]\).
-
Give the \(x\)-coordinate(s) of all points where \(f(x)\) has a local maximum.
\(f(x)\) has a local maximum when \(f'(x)=0\) and changes from positive to negative.
\(x=.49\)
The critical points are the places where \(f'(x)=0\) which are \(x=-6.32\), \(x=.49\) and \(x=6.59\). However, not every critical point is a local maximum. To be a maximum, the curve must change from increasing to decreasing. In other words, \(f'(x)\) must change from positive to negative. This only happens at \(x=.49\).
-
On what interval(s) is \(f(x)\) concave up?
\(f(x)\) is concave up when \(f''(x) \gt 0\). In other words, \(f'(x)\) is increasing.
\([-10.00, -3.48], [3.98,10.00]\)
\(f(x)\) is concave up when \(f''(x) \gt 0\). This means, \(f'(x)\) is increasing which is on the intervals \([-10.00, -3.48]\) and \([3.98,10.00]\).
-
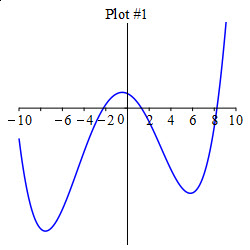
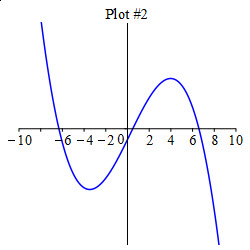
Which of these graphs is \(f(x)\)?
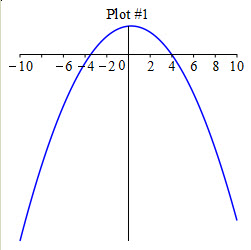
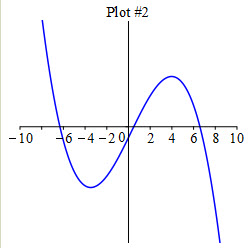
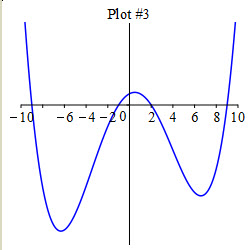
Look at the intervals where \(f'(x)\) is positive and negative.
Plot \(3\).
\(f'(x)\) switches between negative and positive at each of the points \(-6.32\), \(.49\) and \(6.59\). This means \(f(x)\) alternates between decreasing and increasing at each of these points. This happens in Plot 3.
-
Which of these graphs is \(f''(x)\)?
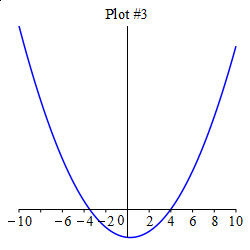
Look at the intervals where \(f'(x)\) is increasing and decreasing.
Plot \(3\).
\(f'(x)\) increases until \(x=-3.48\), then decreases until \(x=3.98\) and then increases again. This means \(f''(x)\) is positive, then negative and finally positive again. This is Plot \(3\).
Heading
Placeholder text: Lorem ipsum Lorem ipsum Lorem ipsum Lorem ipsum Lorem ipsum Lorem ipsum Lorem ipsum Lorem ipsum Lorem ipsum Lorem ipsum Lorem ipsum Lorem ipsum Lorem ipsum Lorem ipsum Lorem ipsum Lorem ipsum Lorem ipsum Lorem ipsum Lorem ipsum Lorem ipsum Lorem ipsum Lorem ipsum Lorem ipsum Lorem ipsum Lorem ipsum