19. Properties of Graphs
f. Interpreting Graphs
2. Of the Second Derivative
Given a function \(f(x)\), we can graph \(f(x)\), \(f'(x)\) and \(f''(x)\). We here look at what each graph says about the other two. For example:
- The intervals on which \(f'(x)\) is negative, are the intervals on which \(f(x)\) is decreasing.
- The intervals on which \(f''(x)\) is positive, are the intervals on which \(f'(x)\) is increasing and on which \(f(x)\) is concave up.
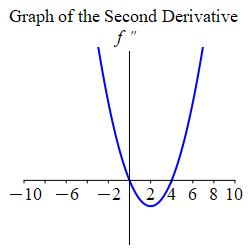
The figure at the right shows the graph of \(f''(x)\). Answer each question using only the numbers: \[\begin{aligned} &-10.00, \quad -1.58, \quad 0, \quad 2.00, \quad 4.00, \quad 7.58, \quad 10.00 \end{aligned}\] Assume the behavior of the graph at the left and right continues out to \(-10\) and \(10\).
-
On what interval(s) is \(f(x)\) concave up?
\(f(x)\) is concave up when \(f''(x) \gt 0\).
\([-10, 0]\) and \([4, 10]\)
The function \(f(x)\) is concave up where \(f''(x) \gt 0\). This occurs on the the intervals \([-10, 0]\) and \([4, 10]\).
-
Find the inflection points of the function \(f(x)\)?
The inflection points of the function \(f(x)\) occur at value(s) \(x = c\) where \(f''(c)=0\) and the value of \(f''(x)\) changes signs on either side of \(c\).
\(x = 0\) and \(x = 4\)
The inflection points of the function \(f(x)\) occur at value(s) \(x = c\) where \(f''(c)=0\) and the value of \(f''(x)\) changes signs on either side of \(c\). This behavior occurs at the points \(x = 0\) and \(x = 4\). Therefore, the function \(f(x)\) has inflection points at \(x = 0\) and \(x = 4\).
-
On what interval(s) is \(f'(x)\) decreasing?
\(f'(x)\) is decreasing when its slope is negative but \(f''(x)\) is the slope of \(f'(x)\).
\([0,4]\)
\(f'(x)\) is decreasing when its slope is negative. Since \(f''(x)\) is the slope of \(f'(x)\), \(f'(x)\) is decreasing when \(f''(x) \lt 0\). \(f''(x)\) is negative on the interval \([0,4]\). Therefore, \(f'(x)\) is decreasing on the interval \([0,4]\).
-
Which of these graphs is \(f(x)\)?
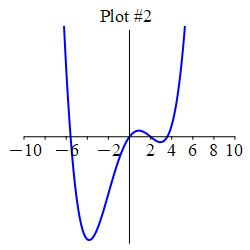
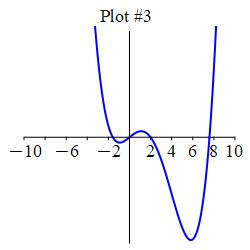
Look at the intervals where \(f''(x)\) is positive and negative to determine the concavity of \(f(x)\) and find the location of the function's inflection points.
Plot \(3\).
\(f''(x)\) is positive on the intervals \([-10, 0]\) and \([4, 10]\) and negative on the interval \([0,4]\). This means \(f(x)\) is concave up on the intervals \([-10, 0]\) and \([4, 10]\) and concave down on the interval \([0,4]\). Furthermore, since \(f''(x)\) changes signs at the points \(x = 0\) and \(x = 4\), we know that \(f(x)\) changes concavity at \(x = 0\) and \(x = 4\). This happens in Plot \(3\).
-
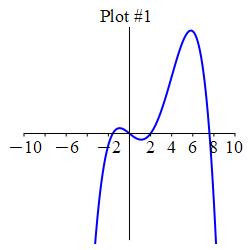
Which of these graphs is \(f'(x)\)?
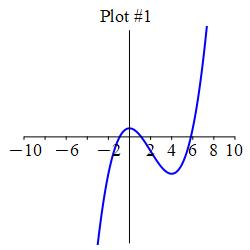
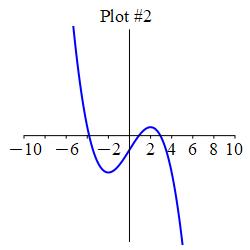
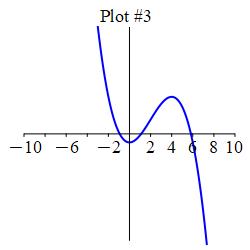
What does \(f''(x)\) positive or negative say about the graph of \(f'\)?
Plot \(1\).
\(f''(x)\) is positive on the intervals \([-10, 0]\) and \([4, 10]\) and negative on the interval \([0,4]\). Therefore, \(f'(x)\) is increasing on the intervals \([-10, 0]\) and \([4, 10]\) and decreasing on the interval \([0,4]\). Furthermore, \(f''\) changes from positive to negative at the point \(x = 0\). So \(f'\) switches from increasing to decreasing at \(x = 0\) which is then a maximum of \(f'\). Similarly, \(f''\) switches from negative to positive at the point \(x = 4\). So \(f'\) switches from decreasing to increasing at \(x = 4\) which is then a minimum of \(f'\). This is behavior is exhibited by Plot \(1\).
Heading
Placeholder text: Lorem ipsum Lorem ipsum Lorem ipsum Lorem ipsum Lorem ipsum Lorem ipsum Lorem ipsum Lorem ipsum Lorem ipsum Lorem ipsum Lorem ipsum Lorem ipsum Lorem ipsum Lorem ipsum Lorem ipsum Lorem ipsum Lorem ipsum Lorem ipsum Lorem ipsum Lorem ipsum Lorem ipsum Lorem ipsum Lorem ipsum Lorem ipsum Lorem ipsum