19. Properties of Graphs
b. Value & Limit Information
3. Horizontal Asymptotes
A horizontal asymptote of a function \(f(x)\) is a horizontal line \(y=b\) where \[ \lim_{x\to-\infty}f(x)=b \quad \text{or} \quad \lim_{x\to\infty}f(x)=b \]
To find the horizontal asymptotes, we compute the limits: \[ \lim_{x\to-\infty}f(x) \quad \text{and} \quad \lim_{x\to\infty}f(x) \] If either of these limits is finite, then that is a horizontal asymptote. Once we find a horizontal asymptote, \(f=b\), we want to know if the function approaches the asymptote from above or below. In other words, we want to know which of the following plots represents the qualitative behavior of the graph of \(f(x)\) at \(-\infty\) and \(\infty\).
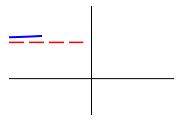
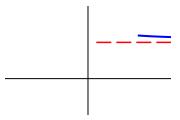
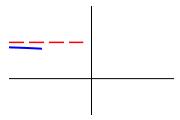
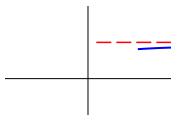
To determine if the function, \(f(x)\), approaches the asymptote \(y=b\) from above or below, we determine if the function \(f(x)-b\) is positive or negative for large \(x\).
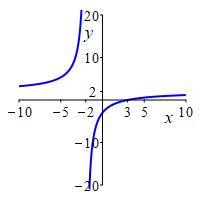
Find the horizontal asymptotes of the function \(f(x)=\dfrac{2x^2-10x+12}{x^2-4}\).
For each asymptote \(y=b\), determine whether \(f(x)\) approaches \(b\) from
above or below, i.e. which of the above plots gives the qualitative behavior
of the graph at \(\pm\infty\).
This is the same function as the last exercise on the
previous two pages.
We compute the limits as \(x\to\pm\infty\): \[\begin{aligned} \lim_{x\to\infty}f(x) &=\lim_{x\to\infty}\dfrac{2x^2-10x+12}{x^2-4} =\lim_{x\to\infty}\dfrac{2-\dfrac{10}{x}+\dfrac{12}{x^2}}{1-\dfrac{4}{x^2}}=2 \\ \lim_{x\to-\infty}f(x) &=\lim_{x\to-\infty}\dfrac{2x^2-10x+12}{x^2-4} =\lim_{x\to-\infty}\dfrac{2-\dfrac{10}{x}+\dfrac{12}{x^2}}{1-\dfrac{4}{x^2}}=2 \end{aligned}\] So the asymptotes are \(y=2\) at \(-\infty\) and \(y=2\) at \(\infty\).
We now compute \(f(x)-2\) to see if it is positive or negative near \(\pm\infty\):
\[\begin{aligned}
f(x)-2&=\dfrac{2x^2-10x+12}{x^2-4}-2 \\
&=\dfrac{2(x^2-4)-10(x-2)}{x^2-4}-2
=-10\dfrac{1}{x+2}
\end{aligned}\]
So if \(x \gt -2\) then \(f(x)-2 \lt 0\) and if \(x \lt -2\) then
\(f(x)-2 \gt 0\). This says that \(y\) approaches \(2\) from above as
\(x\to-\infty\) and \(y\) approaches \(2\) from below as \(x\to\infty\).
We add the information about the horizontal asymptotes to the number line:
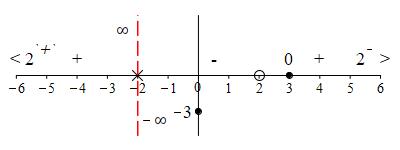
The plot shows the function approaches the horizontal asymptote \(y=2\) from above at \(-\infty\) and from below at \(+\infty\).
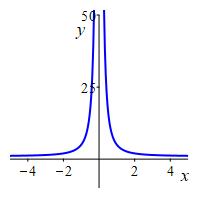
Find the horizontal asymptotes of the function \(f(x)=1+\dfrac{4}{x^2}\).
For each asymptote \(y=b\), determine whether \(f(x)\) approaches \(b\) from
above or below, i.e. which of the above plots gives the qualitative behavior
of the graph at \(\pm\infty\).
This is the same function as in an exercise on the
previous two pages.
The horizontal asymptotes are \(y=1\) at both \(-\infty\) and \(\infty\),
and both are approached from above.
To find the horizontal asymptotes, we compute the limits:
\[\begin{aligned}
\lim_{x\to\infty}f(x)
&=\lim_{x\to\infty}1+\dfrac{4}{x^2}=1 \\
\lim_{x\to-\infty}f(x)
&=\lim_{x\to-\infty}1+\dfrac{4}{x^2}=1
\end{aligned}\]
So the asymptotes are \(y=1\) at both \(-\infty\) and \(\infty\).
Since \(f(x)-1=\dfrac{4}{x^2}\) is everywhere positive, \(y\) approaches
\(1\) from above at both \(-\infty\) and \(\infty\).
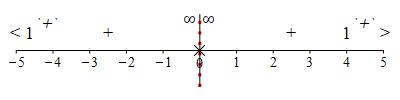
We add the information about the horizontal asymptotes to the number line:
The plot shows the function approaches the asymptote \(y=0\) from above at both \(-\infty\) and \(+\infty\).
In the example and exercise above, the horizontal asymptotes at \(-\infty\) and \(\infty\) were the same line. Not so in the next exercise.
Find the intercepts and vertical and horizontal asymptotes of the function \(f(x)=\dfrac{x-3|x-2|}{x-2}\). For each asymptote, determine the direction(s) of approach.
\(\displaystyle xxx\)
The \(y\)-intercept is
\[
f(0)=\dfrac{0-3|0-2|}{0-2}=3
\]
To find the \(x\)-intercepts, we look separately for \(x \lt 2\) and
\(x \gt 2\). For \(x \lt 2\),
\[
f(x)=\dfrac{x+3(x-2)}{x-2}=\dfrac{4x-6}{x-2}
\]
which is \(0\) when \(x=\dfrac{3}{2}\). For \(x \gt 2\),
\[
f(x)=\dfrac{x-3(x-2)}{x-2}=\dfrac{-2x+6}{x-2}
\]
which is \(0\) when \(x=3\). The function is undefined when \(x=2\) which
is the location of the vertical asymptote. These are shown on the number line:
_x-2_number_line_crit.jpg) To find the directions of approach for the vertical asymptote, we compute
the limits:
\[\begin{aligned}
\lim_{x\to 2^-}f(x)&=\lim_{x\to 2^-}\dfrac{4x-6}{x-2} \\
&=``\dfrac{4\cdot2^--6}{2^--2}"=``\dfrac{6}{0^-}"=-\infty \\
\lim_{x\to 2^+}f(x)&=\lim_{x\to 2^+}\dfrac{-2x+6}{x-2} \\
&=``\dfrac{-2\cdot2^++6}{2^+-2}"=``\dfrac{2}{0^+}"=\infty
\end{aligned}\]
So the function approaches the vertical asymptote downward on the left
and upward on the right:
To find the directions of approach for the vertical asymptote, we compute
the limits:
\[\begin{aligned}
\lim_{x\to 2^-}f(x)&=\lim_{x\to 2^-}\dfrac{4x-6}{x-2} \\
&=``\dfrac{4\cdot2^--6}{2^--2}"=``\dfrac{6}{0^-}"=-\infty \\
\lim_{x\to 2^+}f(x)&=\lim_{x\to 2^+}\dfrac{-2x+6}{x-2} \\
&=``\dfrac{-2\cdot2^++6}{2^+-2}"=``\dfrac{2}{0^+}"=\infty
\end{aligned}\]
So the function approaches the vertical asymptote downward on the left
and upward on the right:
_x-2_number_line_vasympt.jpg) To find the horizontal asymptotes, we compute the limits:
\[\begin{aligned}
\lim_{x\to-\infty}f(x)
&=\lim_{x\to-\infty}\dfrac{4x-6}{x-2}=4 \\
\lim_{x\to\infty}f(x)
&=\lim_{x\to\infty}\dfrac{-2x+6}{x-2}=-2
\end{aligned}\]
So the asymptotes are \(y=4\) at \(x=-\infty\) and \(y=-2\) at \(x=\infty\).
To find the direction of approach for \(y=4\) at \(x=-\infty\), we compute
\[
f(x)-4=\dfrac{4x-6}{x-2}-4=\dfrac{4x-6-4x+8}{x-2}=\dfrac{2}{x-2}
\]
which is negative as \(x\to-\infty\). To find the direction of approach
for \(y=-2\) at \(x=\infty\), we compute
\[
f(x)+2=\dfrac{-2x+6}{x-2}+2=\dfrac{-2x+6+2x-4}{x-2}=\dfrac{2}{x-2}
\]
which is positive as \(x\to\infty\). These are added to the number line:
To find the horizontal asymptotes, we compute the limits:
\[\begin{aligned}
\lim_{x\to-\infty}f(x)
&=\lim_{x\to-\infty}\dfrac{4x-6}{x-2}=4 \\
\lim_{x\to\infty}f(x)
&=\lim_{x\to\infty}\dfrac{-2x+6}{x-2}=-2
\end{aligned}\]
So the asymptotes are \(y=4\) at \(x=-\infty\) and \(y=-2\) at \(x=\infty\).
To find the direction of approach for \(y=4\) at \(x=-\infty\), we compute
\[
f(x)-4=\dfrac{4x-6}{x-2}-4=\dfrac{4x-6-4x+8}{x-2}=\dfrac{2}{x-2}
\]
which is negative as \(x\to-\infty\). To find the direction of approach
for \(y=-2\) at \(x=\infty\), we compute
\[
f(x)+2=\dfrac{-2x+6}{x-2}+2=\dfrac{-2x+6+2x-4}{x-2}=\dfrac{2}{x-2}
\]
which is positive as \(x\to\infty\). These are added to the number line:
_x-2_number_line_hasympt.jpg)
The plot shows the function has \(x\)-intercepts at \(x=\dfrac{3}{2}\) and \(x=3\) and a \(y\)-intercept at \(y=3\). It approaches the vertical asymptote \(x=2\) down on the left and up on the right. At \(-\infty\) it approaches the asymptote \(y=4\) from below and at \(\infty\) it approaches the asymptote \(y=-2\) from above. This is essentially enough to plot the function, but it would be nice to know it is always decreasing and there are no inflection points.
_x-2.jpg)
Heading
Placeholder text: Lorem ipsum Lorem ipsum Lorem ipsum Lorem ipsum Lorem ipsum Lorem ipsum Lorem ipsum Lorem ipsum Lorem ipsum Lorem ipsum Lorem ipsum Lorem ipsum Lorem ipsum Lorem ipsum Lorem ipsum Lorem ipsum Lorem ipsum Lorem ipsum Lorem ipsum Lorem ipsum Lorem ipsum Lorem ipsum Lorem ipsum Lorem ipsum Lorem ipsum