10. Derivatives and Tangent Lines
c. Derivative as a Function
2. Sloe, Increasing and Decreasing
All the Applications of Derivatives at a Point, can now be done using functions. And there are several additional applications, like acceleration and jerk on the next page.
Slope
The derivative of the function, \(f(x)\), is the function, \(f'(x)\), which gives the slope of the tangent line at each point.
Find the slope of the tangent line to a function, \(f(x)=x^3\), at each of the points \(x=-1\), \(x=1\), \(x=2\) and \(x=3\).
\(f'(x)=3x^2\)
\(f'(-1)=3 \qquad f'(1)=3 \qquad f'(2)=12 \qquad f'(3)=27\)
Rather than compute the \(3\) slopes separately, we compute them all at once: \[\begin{aligned} f'(x)&=\lim_{h\to0} \dfrac{f(x+h)-f(x)}{h} \\ &=\lim_{h\to0} \dfrac{(x+h)^3-x^3}{h} \\ &=\lim_{h\to0} \dfrac{(x^3+3x^2h+3xh^2+h^3)-x^3}{h} \\ &=\lim_{h\to0} \dfrac{3x^2h+3xh^2+h^3}{h} \\ &=\lim_{h\to0} (3x^2+3xh+h^2)=3x^2 \end{aligned}\]
Then \[ f'(-1)=3 \qquad f'(1)=3 \qquad f'(2)=12 \qquad f'(3)=27 \]
Increasing and Decreasing
Since the first derivative of \(f(x)\) is the slope of the tangent line, we can use it to tell if the function is increasing or decreasing.
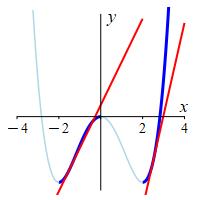
In a region where the function is getting bigger as we move from left to right, the curve is increasing. If the derivative is positive, \(f'(x)\gt0\), then the slope is positive and the function is increasing.
The function at the right is increasing on \([-2,0]\) and \([2,\infty)\) as indicated by the red tangent lines.
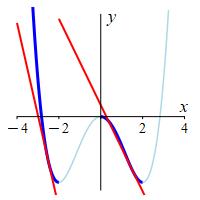
In a region where the function is getting smaller as we move from left to right, the curve is decreasing. If the derivative is negative, \(f'(x)\lt0\), then the slope is negative and the function is decreasing.
The function at the right is decreasing on \((-\infty,-2]\) and \([0,2]\) as indicated by the red tangent lines.
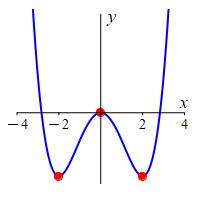
Find the intervals where the graph of \(f(x)=x^4-8x^2\) is increasing and decreasing.
We find the derivative and factor it:
\[\begin{aligned}
f'(x)&=\lim_{h\to0} \dfrac{f(x+h)-f(x)}{h} \\
&=\lim_{h\to0} \dfrac{[(x+h)^4-8(x+h)^2]-(x^4-8x^2)}{h} \\
&=\lim_{h\to0} \dfrac{1}{h}\Big[(x^4+4x^3h+6x^2h^2+4xh^3+h^4)\Big. \\
&\qquad\qquad\quad\Big.-8(x^2+2xh+h^2)-(x^4-8x^2)\Big] \\
&=\lim_{h\to0} \dfrac{4x^3h+6x^2h^2+4xh^3+h^4-16xh-8h^2}{h} \\
&=\lim_{h\to0} (4x^3+6x^2h+4xh^2+h^3-16x-8h) \\
&=4x^3-16x
=4x(x-2)(x+2)
\end{aligned}\]
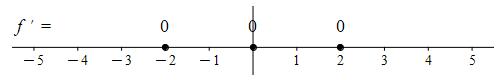
The interesting points are where \(f'(x)=0\), i.e. \(x=0,2,-2\).
These are called the critical points of the function.
We draw a number line and mark in the critical points:
 We now test a point in each interval to see if \(f'(x)=4x(x-2)(x+2)\) is
positive or negative.
\[\begin{aligned}
f'(-3)&=4(-3)(-5)(-1)&&=-60 \lt 0 \\
f'(-1)&=4(-1)(-3)(1) &&=12 \gt 0 \\
f'(1)&=4(1)(-1)(3) &&=-12 \lt 0 \\
f'(3)&=4(3)(1)(5) &&=60 \gt 0
\end{aligned}\]
We have marked these on the number line along with a line to show increasing
or decreasing:
We now test a point in each interval to see if \(f'(x)=4x(x-2)(x+2)\) is
positive or negative.
\[\begin{aligned}
f'(-3)&=4(-3)(-5)(-1)&&=-60 \lt 0 \\
f'(-1)&=4(-1)(-3)(1) &&=12 \gt 0 \\
f'(1)&=4(1)(-1)(3) &&=-12 \lt 0 \\
f'(3)&=4(3)(1)(5) &&=60 \gt 0
\end{aligned}\]
We have marked these on the number line along with a line to show increasing
or decreasing:
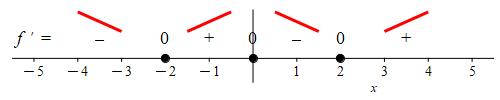
So \(f(x)\) is decreasing on \((-\infty,-2]\cup[0,2]\) and is increasing on \([-2,0]\cup[2,\infty)\).
These facts are verified in a plot.
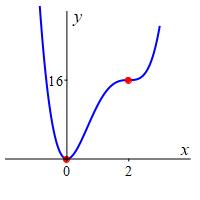
Find the intervals where the graph of \(f(x)=3x^4-16x^3+24x^2\) is increasing and decreasing.
Factor the derivative and determine where it is positive and negative.
\(f(x)\) is decreasing on \((-\infty,0]\) and is increasing on \([0,\infty)\).
We find the derivative and factor it:
\[\begin{aligned}
f'(x)&=\lim_{h\to0} \dfrac{f(x+h)-f(x)}{h} \\
&=\lim_{h\to0} \dfrac{1}{h}\left(\rule{0pt}{12pt}\left[\rule{0pt}{9pt}3(x+h)^4-16(x+h)^3+24(x+h)^2\right]\right. \\
&\qquad\qquad\quad-\left.\rule{0pt}{12pt}\left[\rule{0pt}{9pt}3x^4-16x^3+24x^2\right]\right) \\
&=\lim_{h\to0} \dfrac{1}{h}\left(\rule{0pt}{12pt}\left[\rule{0pt}{9pt}3(x^4+4x^3h+O(h^2))
-16(x^3+3x^2h+O(h^2))\right.\right. \\
&\qquad\qquad\quad\left.\rule{0pt}{12pt}\left.\rule{0pt}{9pt}+24(x^2+2xh+h^2)\right]
-\left[\rule{0pt}{9pt}3x^4-16x^3+24x^2\right]\right) \\
&=\lim_{h\to0} \dfrac{1}{h}\left(12x^3h-48x^2h+48xh+O(h^2)\right) \\
&=\lim_{h\to0} \left(12x^3-48x^2+48x+O(h)\right) \\
&=12x^3-48x^2+48x=12x(x^2-4x+4)=12x(x-2)^2
\end{aligned}\]
Where \(O(h^n)\) means terms with powers of \(h\) of degree \(n\) or higher.
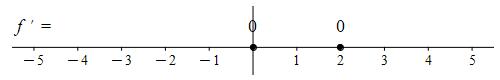
The interesting points are where \(f'(x)=0\), i.e. \(x=0,2\).
We draw a number line and mark in these critical points:
 We now test a point in each interval to see if \(f'(x)=12x(x-2)^2\) is
positive or negative.
\[\begin{aligned}
f'(-1)&=12(-1)(-3)^2 &&=-108 \lt 0 \\
f'(1)&=12(1)(-1)^2 &&=12 \gt 0 \\
f'(3)&=12(3)(1)^2 &&=36 \gt 0
\end{aligned}\]
We have marked these on the number line along with a line to show increasing
or decreasing:
We now test a point in each interval to see if \(f'(x)=12x(x-2)^2\) is
positive or negative.
\[\begin{aligned}
f'(-1)&=12(-1)(-3)^2 &&=-108 \lt 0 \\
f'(1)&=12(1)(-1)^2 &&=12 \gt 0 \\
f'(3)&=12(3)(1)^2 &&=36 \gt 0
\end{aligned}\]
We have marked these on the number line along with a line to show increasing
or decreasing:
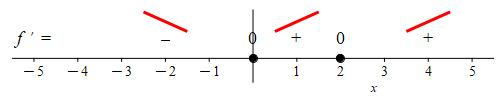
Notice \(f(x)\) is decreasing on \((-\infty,0]\) and is increasing on \([0,\infty)\), even though it becomes horizontal at \(x=2\).
These facts are verified in a plot.
Heading
Placeholder text: Lorem ipsum Lorem ipsum Lorem ipsum Lorem ipsum Lorem ipsum Lorem ipsum Lorem ipsum Lorem ipsum Lorem ipsum Lorem ipsum Lorem ipsum Lorem ipsum Lorem ipsum Lorem ipsum Lorem ipsum Lorem ipsum Lorem ipsum Lorem ipsum Lorem ipsum Lorem ipsum Lorem ipsum Lorem ipsum Lorem ipsum Lorem ipsum Lorem ipsum