16. Max-Min Problems
a. Local Minima, Local Maxima and Saddle Points
1. Functions of \(1\) Variable
We first review the definitions of a local maximum and a local minimum for functions of \(1\) variable.
For a function of \(1\) variable, \(f(x)\), a local or relative maximum (resp. local or relative minimum) occurs at a point, \(x=c\), where the function value is relatively larger (resp. smaller) than those at all . Together, local minima and maxima are called local or relative extrema.
When we say nearby, we actually mean that there is some interval around \(c\) within which \(f(c)\) is the largest (resp. smallest) value. We don't care what happens far away from \(c\).
For a function of \(1\) variable, \(f(x)\), extrema occur when the tangent line is horizontal or the derivative does not exist. We search for extrema by identifying critical points (points, \(c\), at which the derivative, \(f'(c)\), is zero or undefined) and classifying each as a local minimum, a local maximum or a horizontal inflection point (at which nearby values are larger on one side and smaller on the other). There are no saddle points for functions of \(1\) variable.
Assuming all derivatives exist, we distinguish between these three possibilities by first looking at the second derivative:
- If \(f''(c) > 0\), then the critical point \(c\) is a local minimum.
- If \(f''(c) < 0\), then the critical point \(c\) is a local maximum.
- If \(f''(c)=0\), then the TEST FAILS.
\(f''(c) \gt 0\)
\(f''(c) \lt 0\)\
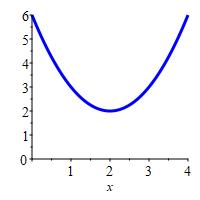
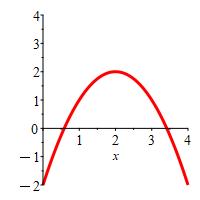
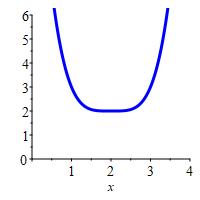
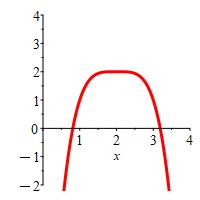
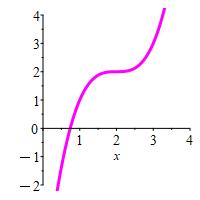
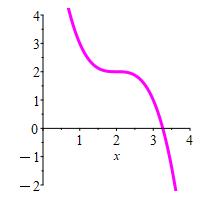
Here are four functions which all have a critical point at \(x=2\) and all satisfy \(f''(2)=0\). However, one has a local minimum, one has a local maximum and two have horizontal inflection points. So the condition \(f''(2)=0\) cannot distinguish between the three cases.
When the Second Derivative Test fails, we turn to the first derivative:
- If \(f'(x) < 0\) for \(x < c\) and \(f'(x) > 0\) for \(x > c\), then the critical point \(c\) is a local minimum.
- If \(f'(x) > 0\) for \(x < c\) and \(f'(x) < 0\) for \(x > c\), then the critical point \(c\) is a local maximum.
- If \(f'(x) < 0\) for \(x < c\) and \(x > c\), or \(f'(x) > 0\) for \(x < c\) and \(x > c\), then the critical point \(c\) is an inflection point.
When we specify the sign of \(f'\) on \(x < c\) and \(x > c\), we actually mean that there is some interval around \(c\) within which these conditions on \(f'\) hold. For local extrema, we don't care what happens far away from \(c\).
Local Minimum
Local Maximum
Inflection Point
Inflection Point
We now generalize these ideas to two or more variables.
Heading
Placeholder text: Lorem ipsum Lorem ipsum Lorem ipsum Lorem ipsum Lorem ipsum Lorem ipsum Lorem ipsum Lorem ipsum Lorem ipsum Lorem ipsum Lorem ipsum Lorem ipsum Lorem ipsum Lorem ipsum Lorem ipsum Lorem ipsum Lorem ipsum Lorem ipsum Lorem ipsum Lorem ipsum Lorem ipsum Lorem ipsum Lorem ipsum Lorem ipsum Lorem ipsum