1. Coordinate Systems
a. Rectangular Coordinates - 2D, 3D and nD
1. 2D Rectangular Coordinates
The Rectangular Coordinate System in the plane (also called the Cartesian Coordinate System after its creator, Rene Descartes) is a method of uniquely identifying points in a plane by giving two numbers. A grid is drawn with a pair of lines (axes) drawn perpendicular to each other. The horizontal axis is called the \(x\)-axis, and the vertical axis is called the \(y\)-axis. The point at which the axes intersect is called the origin, \(O\). The axes are marked off in unit lengths that can be used to locate points in the \(xy\)-plane. Each point in the plane is specified by giving an ordered pair \((x,y)\). The first number is the \(x\)-coordinate (its horizontal position on the \(x\)-axis) and the second number is the \(y\)-coordinate (its vertical position on the \(y\)-axis). \(x\)-coordinates are positive to the right of the origin and negative to the left. \(y\)-coordinates are positive above the origin and negative below. Since it takes \(2\) \(\mathbb{R}\)eal numbers to specify a point, the plane is also called \(\mathbb{R}^2\). In the plot, we have marked in the point \(P=(4,3)\):
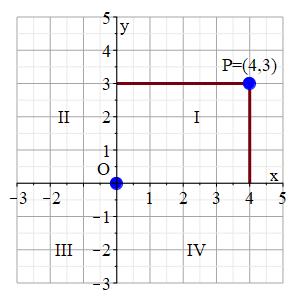
The intersecting axes create four Quadrants, labeled I, II, III and IV counterclockwise starting from the top right as shown above. The table shows which coordinates are positive or negative in each quadrant.
| Quadrant: | I | II | III | IV |
|---|---|---|---|---|
| \(x\) | \(+\) | \(-\) | \(-\) | \(+\) |
| \(y\) | \(+\) | \(+\) | \(-\) | \(-\) |
When working with symbols, the coordinates of a point are frequently written using subscripts. Thus a point \(P\) may be written as \(P=(p_1,p_2)\).
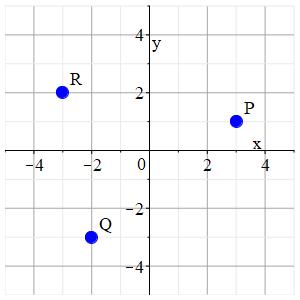
Identify the coordinates of each point in the plot:
| \(P=\) | \((1,3)\) | \((3,1)\) | \((-3,1)\) | \((1,-3)\) |
| \(Q=\) | \((-2,-4)\) | \((-3,-2)\) | \((-2,-3)\) | \((-2,3)\) |
| \(R=\) | \((-3,2)\) | \((3,-2)\) | \((2,-3)\) | \((2,-3)\) |
Heading
Placeholder text: Lorem ipsum Lorem ipsum Lorem ipsum Lorem ipsum Lorem ipsum Lorem ipsum Lorem ipsum Lorem ipsum Lorem ipsum Lorem ipsum Lorem ipsum Lorem ipsum Lorem ipsum Lorem ipsum Lorem ipsum Lorem ipsum Lorem ipsum Lorem ipsum Lorem ipsum Lorem ipsum Lorem ipsum Lorem ipsum Lorem ipsum Lorem ipsum Lorem ipsum