19. Properties of Graphs
b. Value & Limit Information
1. Intercepts & Positive and Negative Values
We start by identifying where the function is positive, negative or zero and where it crosses the \(y\)-axis.
An \(x\)-intercept of \(f(x)\) is a point where
the graph crosses the \(x\)-axis.
A \(y\)-intercept of \(f(x)\) is a point where
the graph crosses the \(y\)-axis.
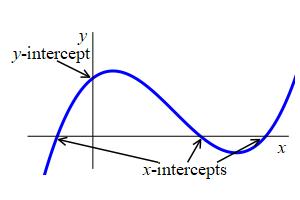
To find the \(x\)-intercepts, we solve the equation \(f(x)=0\). There can be zero, one or many \(x\)-intercepts.
To find the \(y\)-intercepts, we simply plug \(x=0\) into the function, i.e. the \(y\)-intercept is \(f(0)\) if it is defined. There is at most one \(y\)-intercept.
Consider the function \(f(x)=2x-\dfrac{16}{x-2}\). First find any points where the function is undefined. Then find the \(x\)-intercepts, the \(y\)-intercept and the intervals where \(f(x)\) is positive or negative.
We first notice that the function is undefined at \(x=2\). Next, to find the
\(x\)-intercepts, we rewrite the function as:
\[
f(x)=\dfrac{2x(x-2)-16}{x-2}=\dfrac{2x^2-4x-16}{x-2}=\dfrac{2(x+2)(x-4)}{x-2}
\]
A fraction can only be \(0\) if the numerator is \(0\). So, we solve
\(2(x+2)(x-4)=0\). So the \(x\)-intercepts are \(x=-2\) and \(x=4\).
To find the \(y\)-intercepts, we plug in \(x=0\):
\[
f(0)=\dfrac{2(0+2)(0-4)}{0-2}=8
\]
To determine where \(f(x)\) is positive or negative, we first plot the
interesting points on a number line. These are the \(x\)-intercepts,
\(x=-2\) and \(x=4\), and the places where function is undefined, \(x=2\):
_number_line_crit.jpg) Since \(f\) is continuous except where it is undefined, its sign cannot
change without passing through \(0\) or a point where it is undefined.
So there must be a single sign on each of the intervals
\((-\infty,-2)\), \((-2,2)\), \((2,4)\) and \((4,\infty)\).
We can find the signs by plugging in a number in each interval:
\[\begin{aligned}
f(-3)&=\dfrac{2(-3+2)(-3-4)}{-3-2}=-\,\dfrac{14}{5} \quad & f(0)&=\dfrac{2(0+2)(0-4)}{0-2}=8 \\
f(3)&=\dfrac{2(3+2)(3-4)}{3-2}=-10 & f(5)&=\dfrac{2(5+2)(5-4)}{5-2}=\dfrac{14}{3}
\end{aligned}\]
So \(f\) is positive on the intervals \((-2,2)\) and \((4,\infty)\).
And \(f\) is negative on the intervals \((-\infty,-2)\) and \((2,4)\).
We add these facts to the number line:
Since \(f\) is continuous except where it is undefined, its sign cannot
change without passing through \(0\) or a point where it is undefined.
So there must be a single sign on each of the intervals
\((-\infty,-2)\), \((-2,2)\), \((2,4)\) and \((4,\infty)\).
We can find the signs by plugging in a number in each interval:
\[\begin{aligned}
f(-3)&=\dfrac{2(-3+2)(-3-4)}{-3-2}=-\,\dfrac{14}{5} \quad & f(0)&=\dfrac{2(0+2)(0-4)}{0-2}=8 \\
f(3)&=\dfrac{2(3+2)(3-4)}{3-2}=-10 & f(5)&=\dfrac{2(5+2)(5-4)}{5-2}=\dfrac{14}{3}
\end{aligned}\]
So \(f\) is positive on the intervals \((-2,2)\) and \((4,\infty)\).
And \(f\) is negative on the intervals \((-\infty,-2)\) and \((2,4)\).
We add these facts to the number line:
_number_line_signs.jpg)
We will eventually have enough information to plot the function. But so far we can see the \(x\)-intercepts at \(x=-2\) and \(x=4\), the \(y\)-intercept at \(y=8\) and the function is positive on \((-2,2)\) and \((4,\infty)\) and negative on \((-\infty,-2)\) and \((2,4)\). It remains to examine the behavior at \(x=\pm\infty\) and \(y=\pm\infty\), to show the function is everywhere increasing, concave up on the left, concave down on the right, and has no local maxima or minima.
.jpg)
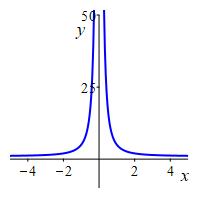
Consider the function \(f(x)=1+\dfrac{4}{x^2}\). First find any points where the function is undefined. Then find the \(x\)-intercepts, the \(y\)-intercept and the intervals where \(f(x)\) is positive or negative. Finally, draw a number line which shows the \(x\)-intercepts (marked by a \(\bullet\)), the points where the function is undefined (marked by an \(\times\)) and the signs of the function between these points.
The function is undefined at \(x=0\). There are no \(x\)-intercepts
nor \(y\)-intercept. The function is always positive.

The function is undefined at \(x=0\). So there is no \(y\)-intercept.
The function is always positive. So there are no \(x\)-intercepts.
We plot these facts on a number line:

We will eventually have enough information to plot the function. But so far we can see there no intercepts and the function is everywhere positive.
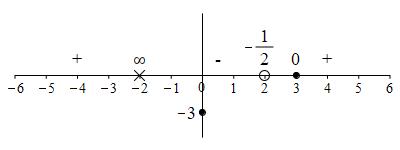
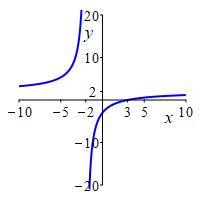
Consider the function \(f(x)=\dfrac{2x^2-10x+12}{x^2-4}\). First find any points where the function is undefined. Then find the \(x\)-intercepts, the \(y\)-intercept and the intervals where \(f(x)\) is positive or negative. Finally, draw a number line which shows the \(x\)-intercepts (marked by a \(\bullet\)), the points where the function is undefined (marked by an \(\times\) if it is \(\pm\infty\) and an \(\circ\) if it is a hole) and the signs of the function between these points.
The function is undefined at \(x=\pm2\). \(x=2\) is a hole while at
\(x=-2\) the function approaches \(\pm\infty\). The \(x\)-intercept is
at \(x=3\). The \(y\)-intercept is \(f(0)=-3\).
The function is positive on \((-\infty,-2)\), negative on \((-2,3)\) and
positive again on \((3,\infty)\).
We first factor the numerator and denominator and cancel any common factors:
\[
f(x)=\dfrac{2x^2-10x+12}{x^2-4}=\dfrac{2(x-2)(x-3)}{(x-2)(x+2)}
=\dfrac{2(x-3)}{x+2}
\]
So the function is undefined at \(x=\pm2\) because the original denominator
is \(0\). However, \(x=2\) is a hole because it cancels out and it
approaches the finite number:
\[
\lim_{x\to2} f(x)=\lim_{x\to2} \dfrac{2(x-3)}{x+2}=-\,\dfrac{1}{2}
\]
On the other hand, \(x=-2\) is a place where the function approaches
\(\pm\infty\) since there is a \(0\) in the denominator even after factoring.
(It is a vertical asymptote which we study on the
next page.)
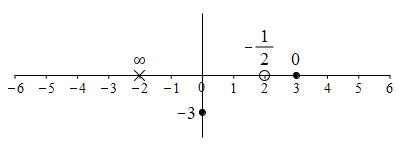
The numerator is \(0\) when \(x=3\) which is the \(x\)-intercept. The
\(y\)-intercept is \(f(0)=\dfrac{2(-3)}{2}=-3\). We plot these on a number
line:
 To find where the function is positive or negative, we evaluate if at
a point in each interval:
\[\begin{aligned}
f(-4)&=\dfrac{2(-4-3)}{-4+2}=7 \quad
& f(0)&=\dfrac{2(-3)}{2}=-3 \\
f(4)&=\dfrac{2(4-3)}{4+2}=\dfrac{1}{3}
\end{aligned}\]
So the function is positive on \((-\infty,-2)\), negative on \((-2,3)\) and
positive again on \((3,\infty)\).

We will eventually have enough information to plot the function. But so far we can see the \(x\)-intercept at \(x=3\), the \(y\)-intercept at \(y=-3\) and that the function is positive on \((-\infty,-2)\) and \((3,\infty)\) and negative on \((-2,3)\).
Heading
Placeholder text: Lorem ipsum Lorem ipsum Lorem ipsum Lorem ipsum Lorem ipsum Lorem ipsum Lorem ipsum Lorem ipsum Lorem ipsum Lorem ipsum Lorem ipsum Lorem ipsum Lorem ipsum Lorem ipsum Lorem ipsum Lorem ipsum Lorem ipsum Lorem ipsum Lorem ipsum Lorem ipsum Lorem ipsum Lorem ipsum Lorem ipsum Lorem ipsum Lorem ipsum